|
|
||||||||||||||||||||||||||||||||||||||||
|
Newsletter · November 2026 TCFP Monthly FocusDear Investment Professional, Please find the November 2026 edition of the Trading Central Financial Products Monthly Focus, covering the TC Quantitative index family, our listed product range and this month’s quantamental research.
|
||||||||||||||||||||||||||||||||||||||||
|
||||||||||||||||||||||||||||||||||||||||
|
Click a currency to explore the listed products (continuous liquidity) on each trading venue.
|
||||||||||||||||||||||||||||||||||||||||
|
||||||||||||||||||||||||||||||||||||||||
|
||||||||||||||||||||||||||||||||||||||||
Data as of October 30th. Bold = index return (NTR); small = excess return vs benchmark. All products & indices: TC website (TCFP section). |
||||||||||||||||||||||||||||||||||||||||
|
||||||||||||||||||||||||||||||||||||||||
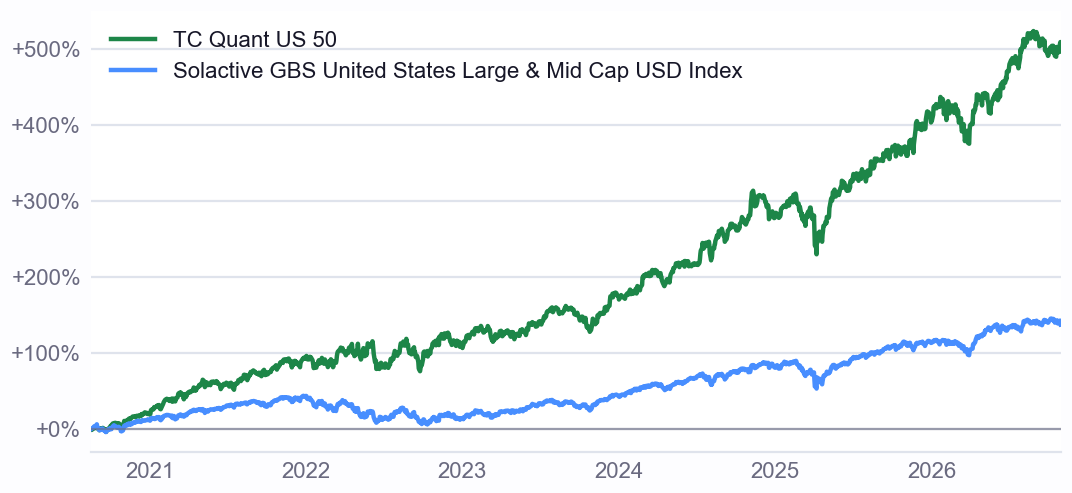
TC Quant US 50 vs Solactive GBS United States Large & Mid Cap US$ Index — cumulative return since 2020-08-19. |
||||||||||||||||||||||||||||||||||||||||
October delivered positive relative performance in three of the four strategies, with longer-term results continuing to demonstrate the strength of the systematic investment approach.
The TC Quant EU 50 led monthly performance, gaining 3.1% and outperforming its benchmark by 1.8 percentage points, while the TC Quant US 50 advanced 1.0%, outperforming by 2.1 percentage points despite a decline in the broader U.S. market.
The TC Quant CA 50 finished October essentially unchanged, trailing its benchmark by 2.4 percentage points. However, Canada remains a standout performer over the past year, gaining 38.9% and exceeding its benchmark by 18.1 percentage points.
The TC Quant WW 50 declined 1.1% in October but outperformed its benchmark by 0.7 percentage points. Looking at the broader 12-month period, the U.S. strategy advanced 26.4%, outperforming by 15.3 percentage points, while the global strategy delivered an 18.1% gain, exceeding its benchmark by 5.9 percentage points.
Overall, the results highlight the ability of the systematic process to deliver strong longer-term relative performance while adapting portfolio exposures to evolving market conditions. |
||||||||||||||||||||||||||||||||||||||||
0–19 20–39 40–59 60–79 80–100
Each bar stacks the index’s holdings by score band. A bar reaches 100% only when every holding carries that factor; the gap is holdings the factor does not score, and n is that count. |
||||||||||||||||||||||||||||||||||||||||
|
||||||||||||||||||||||||||||||||||||||||
Large-cap Mid-cap Small-cap
|
||||||||||||||||||||||||||||||||||||||||
|
||||||||||||||||||||||||||||||||||||||||
Technology Financials Healthcare Industrials Consumer Basic Materials Other sectors
|
||||||||||||||||||||||||||||||||||||||||
|
||||||||||||||||||||||||||||||||||||||||
|
||||||||||||||||||||||||||||||||||||||||
|
Our main partners: GTX · RBC · Vontobel · Solactive · HANetf · JP Morgan · Longpoint· CitiGroup |
||||||||||||||||||||||||||||||||||||||||
|
|
||||||||||||||||||||||||||||||||||||||||
|
Disclaimer The content of this email is provided for informational purposes only and is intended solely for professional clients. By reading on, you confirm that you qualify as a professional investor. If you do not meet this requirement, please disregard this message. This material is impersonal and of a general nature, and does not under any circumstance represent personalized investment, legal, tax, or any form of advice, nor an offer or solicitation to buy, subscribe, or sell any security or financial products of any nature. Prospective investors are advised to seek independent investment advice and be informed of legal requirements, applicable exchange regulations and restrictions, and taxes in their relevant jurisdiction prior to investing in any financial instrument. This content is provided on an “as is” basis. Trading Central makes no guarantees nor warrants the accuracy, consistency, timeliness or completeness of any information or data. Trading Central accepts no liability for any errors, indirect consequential loss or damages whatsoever relating to the accuracy, completeness or use of this material to conduct any financial instrument transaction. Past performance of a financial instrument does not guarantee, nor is indicative of, future performance or results. The values of financial instruments change frequently and are not guaranteed. Trading Central takes all reasonable measures to identify, monitor, and manage potential conflicts of interest. Trading Central has no capital ties to the issuers of the financial products featured here, and/or covered by its analyses, nor does it disclose its insights and analysis to such issuers prior to dissemination. Trading Central may assist proprietary index administrators and enter into agreements with financial instrument issuers, and may receive remuneration for such services, including in relation to indices referenced by the financial instruments identified in Trading Central products. |
||||||||||||||||||||||||||||||||||||||||
| TRADING CENTRAL 11 bis rue Scribe, 75009 Paris, France tradingcentral.com/tc-financial-products · tcfp@tradingcentral.com You receive this email as a TCFP professional contact. Unsubscribe here |